


Abstract
The inverse correlation between skin pigmentation and latitude observed in human populations is thought to have been shaped by selective pressures favoring lighter skin to facilitate vitamin D synthesis in regions far from the equator. Several candidate genes for skin pigmentation have been shown to exhibit patterns of polymorphism that overlap the geospatial variation in skin color. However, little work has focused on estimating the time frame over which skin pigmentation has changed and on the intensity of selection acting on different pigmentation genes. To provide a temporal framework for the evolution of lighter pigmentation, we used forward Monte Carlo simulations coupled with a rejection sampling algorithm to estimate the time of onset of selective sweeps and selection coefficients at four genes associated with this trait in Europeans: KITLG, TYRP1, SLC24A5, and SLC45A2. Using compound haplotype systems consisting of rapidly evolving microsatellites linked to one single-nucleotide polymorphism in each gene, we estimate that the onset of the sweep shared by Europeans and East Asians at KITLG occurred approximately 30,000 years ago, after the out-of-Africa migration, whereas the selective sweeps for the European-specific alleles at TYRP1, SLC24A5, and SLC45A2 started much later, within the last 11,000–19,000 years, well after the first migrations of modern humans into Europe. We suggest that these patterns were influenced by recent increases in size of human populations, which favored the accumulation of advantageous variants at different loci.
Introduction
The well-known correlation between skin pigmentation and distance from the equator (Relethford 1997) strongly suggests that natural selection in response to environmental factors played a major role in the geospatial patterning of human skin pigmentation variation. Decreased incident ultraviolet radiation (UVR) was a major environmental change faced by human populations migrating from Africa to higher latitudes. Because the levels of UVR required to synthesize vitamin D are known to be higher in individuals with darker skin (Holick 2003; Chen et al. 2007), it has been suggested that selection favored lighter skin to maximize the production of vitamin D in regions with lower UVR (Loomis 1967; Jablonski and Chaplin 2000). However, lack of knowledge about the genetic basis of natural variation in skin pigmentation has prevented the evaluation at the molecular level of the role played by natural selection in shaping the variation of this complex phenotype among human populations (Parra 2007).
Recently, several genes affecting melanin production and melanin function have been shown to influence normal pigmentation variation in human populations by using association approaches and/or direct functional assays (reviewed in Parra 2007; Sturm 2009; Rees and Harding 2012). Most of these genes have geospatial patterns of genetic variation that are correlated with the geographic distribution of skin pigmentation and display strong evidence for selective sweeps in European and East Asian populations (Izagirre et al. 2006; McEvoy et al. 2006; Soejima et al. 2006; Voight et al. 2006; Lao et al. 2007; Myles et al. 2007; Norton et al. 2007; Sabeti et al. 2007; Williamson et al. 2007; Pickrell et al. 2009). In addition, the picture emerging from the genetic data suggests that skin pigmentation has a complex evolutionary history, with selection acting on different genes at different times and geographic locations (McEvoy et al. 2006; Lao et al. 2007; Myles et al. 2007; Norton et al. 2007; Pickrell et al. 2009). Some genes, such as KITLG, have derived alleles (associated with lighter pigmentation) that reach high frequencies both in European and East Asian populations and likely began to be selected in a proto Eurasian population (Lao et al. 2007; Williamson et al. 2007; Pickrell et al. 2009). Other genes have derived alleles with a distribution primarily restricted to either Europe (SLC24A5, SLC45A2 and TYRP1) or East Asia (DCT and ATRN), suggesting that different genes are responsible for the reduction of melanin content in Europeans and East Asians (McEvoy et al. 2006; Lao et al. 2007; Myles et al. 2007; Norton et al. 2007; Pickrell et al. 2009). Additional evidence for convergent adaptation is provided by genes such as OCA2, in which different skin lightening alleles have likely experienced independent sweeps in Europeans and East Asians (Lao et al. 2007; Edwards et al. 2010; Donnelly et al. 2011).
Taken together, these findings are broadly consistent in showing that human populations migrating to higher latitudes moved from a darkly pigmented ancestral state toward lighter pigmentation due to genetic adaptation in response to spatially varying selective pressures (Jablonski and Chaplin 2000; Jablonski 2004; Parra 2007). However, limited work has focused on estimating the time frame over which pigmentation changed and on the intensity of selection acting upon different genes. Without this understanding, it is difficult to discriminate between contrasting evolutionary scenarios that are compatible with the available data. For example, some distributions of derived alleles in European populations are consistent with both an early sweep, starting soon after the migration of anatomically modern humans into Europe, and with more recent dates occurring long after the arrival of modern human populations to the continent (Cavalli-Sforza et al. 1994; Norton and Hammer 2008). Similarly, selective sweeps at genes such as KITLG may have occurred immediately after the out-of-Africa migration or only shortly before the split between Europeans and Asians, following a period of coexistence of Eurasian populations in western Asia (Gutenkunst et al. 2009; Laval et al. 2010; Rasmussen et al. 2011).
Here, we present an analysis of the evolutionary history of human pigmentation focused on the estimation of the ages and strength of selective sweeps at four genes that are known to influence normal variation in pigmentation levels: KITLG, SLC25A5, and SLC45A2, which explain a significant portion of the skin color differences between European and West African populations (Lamason et al. 2005; Miller et al. 2007; Norton et al. 2007), and TYRP1, which is associated with variation in iris pigmentation and hair color within Europe (Frudakis et al. 2003; Sulem et al. 2008; Liu et al. 2010). The modes of our age estimates indicate that the derived lineage shared by Europeans and East Asians at KITLG started to rise in frequency approximately 30,000 years ago, after the out-of-Africa migration, whereas the selective sweeps for the European-specific alleles at TYRP1, SLC24A5, and SLC45A2 occurred only within the last 11,000–19,000 years and not immediately after the first migrations of modern humans into Europe. We suggest that this pattern was influenced by increases in European population size, which lowered the levels of drift and favored the recent accumulation of advantageous variants at different loci.
Materials and Methods
DNA Samples
Pigmentation-associated single-nucleotide polymorphisms (SNPs) and linked microsatellite markers were typed in different collections of samples. The tag SNPs rs642742A>G and rs2733831A>G for KITLG and TYRP1, respectively, were typed together with linked microsatellites in 50 Portuguese individuals (all of European ancestry) and 70 individuals of Sub-Saharan African ancestry (30 Ovimbundu from Angola and 20 Makhuwa, 18 Ronga, and 2 Shangaan from Mozambique). SNPs rs1426654 and rs16891982 at the SLC24A5 and SLC45A2 genes, respectively, were typed with the associated microsatellite markers in 212 European-Americans. All research participants were recruited according to protocols and informed consent procedures approved by the institutional review boards of participant institutions. We also typed all microsatellite markers in samples from the HapMap project with available genotype information for the selected SNPs (Frazer et al. 2007). This data set consists of 30 parent–offspring trios of European ancestry (European-Americans collected by CEPH, CEU), 30 parent–offspring trios of African Ancestry (Yoruba from West Africa, YRI), and 90 unrelated individuals of East Asian ancestry (45 Japanese and 45 Han Chinese individuals), which were combined into a single East Asian group in this work (EAS) (Frazer et al. 2007).
SNP and Microsatellite Selection and Genotyping
Tag SNPs at SLC24A5 (rs1426654G>A), SLC45A2 (rs16891982C>G), KITLG (rs642742A>G) and TYRP1 (rs2733831A>G) loci were chosen because of their previously reported association with normal pigmentation variation and location in extended haplotypes with signs of positive selection (Frudakis et al. 2003; Lamason et al. 2005; Izagirre et al. 2006; McEvoy et al. 2006; Soejima et al. 2006; Voight et al. 2006; Lao et al. 2007; Miller et al. 2007; Myles et al. 2007; Norton et al. 2007; Sabeti et al. 2007; Stokowski et al. 2007; Williamson et al. 2007; Sulem et al. 2008). SNP rs642742 is a highly conserved site, located 326 kb upstream of the KITLG transcription start site, with a possible regulatory effect in KITLG expression and measured effects in skin pigmentation variation between European and West Africans (Miller et al. 2007). The tag SNPs at SLC24A5 and SLC45A2 (rs1426654 and rs16891982) are nonsynonymous polymorphisms that explain a substantial proportion of skin pigmentation differences between Europeans and West Africans (Lamason et al. 2005; Norton et al. 2007). The tag for TYRP1 is a highly conserved intronic SNP in strong linkage disequilibrium with variants (rs2733832, r2 = 0.9 and rs1408799, r2 = 0.68) associated with iris pigmentation and hair color variation in Europe (Frudakis et al. 2003; Frazer et al. 2007; Sulem et al. 2008).
To characterize the haplotype diversity (HD) associated with SNP-defined lineages at SLC24A5, SLC45A2, TYRP1, and KITLG, we screened these genes and their flanking sequences for potential polymorphic repeat arrays, using the UCSC Genome browser website (http://genome.ucsc.edu). Microsatellites were selected according to the following criteria: 1) the repeat motif should exhibit ≥6 repetitive units; 2) the repeat motif should be as simple (homogeneous) as possible; and 3) the flanking regions should not harbor A and T repetitive stretches. Detailed information for the microsatellites studied including their physical map position can be found in supplementary table S1, Supplementary Material online.
Typing details for SNPs and microsatellite markers are provided in supplementary protocol, Supplementary Material online.
SNP/Microsatellite Haplotype Reconstruction and Phylogenetic Analysis
Haplotypes consisting of SNPs and linked microsatellite markers were inferred with the PHASE v.2.1 software (Stephens et al. 2001; Stephens and Scheet 2005). We first reconstructed haplotypes from the available father–mother–child trio data from the CEU and YRI HapMap reference populations, using the PHASE-P1 option. The phased trio data were then used to help inferring the haplotypes of the other individuals in the sample.
Allele frequencies, locus heterozygosity, and HD were calculated with the Arlequin v3.1.1 software (Excoffier et al. 2005).
The evolutionary relationships between haplotypes were reconstructed with the NETWORK 4.5 software (www.fluxus-engineering.com). The reduced median (Bandelt et al. 1995) and median-joining (Bandelt et al. 1999) algorithms were applied sequentially to resolve extensive reticulation at the microsatellite loci.
Neutrality Tests
We used the SIMCOAL2.1.2 (Laval and Excoffier 2004) software to perform coalescent simulations of multiple sets of SNP/microsatellite haplotypes, assuming neutral evolution and different demographic scenarios. For each demographic scenario, we ran enough simulations until we obtained at least 5,000 sets of random coalescent trees, in which the frequency of the derived SNP clade was within ±5% of the observed derived SNP allele frequency for the population in question. From each coalescent tree that matched this condition, we calculated on the background of the derived SNP clade the probability of drawing two different haplotypes (HD) and the average variance in microsatellite repeat number (V). This procedure allowed us to generate null distributions of these two intra-allelic diversity statistics and calculate the proportion of simulated values that are lower than the observed values under neutrality for a given demographic model, as a measure of the probability of observing the data by chance alone.
Recombination rates (r) between microsatellite markers and between tag SNPs and adjacent microsatellite loci were interpolated from linkage-disequilibrium-based estimates provided in release 23 of the HapMap Phase 2 data (Frazer et al. 2007), which combine the recombination maps for CEU, YRI, and EAS (supplementary table S1, Supplementary Material online) and, as noted by Pickrell et al. (2009), are unlikely to be affected by population-specific selective sweeps and demography. This recombination map is more refined than the pedigree-based recombination map (Kong et al. 2010), but both maps are highly correlated (Hinch et al. 2011; Wegmann et al. 2011). The mutation rates (µ) of simulated microsatellites (supplementary table S1, Supplementary Material online) were calculated from allele frequency distributions in our African samples, which are not affected by the selective sweeps affecting Eurasian samples. We used the homozygosity-based estimator proposed by Xu and Fu (2004), which is relatively robust to deviations from the pure stepwise mutation model and departures from mutation-drift equilibrium (Xu et al. 2005).
Recent studies have shown that the demographic model most compatible with the data for European and East Asian populations is a bottleneck scenario, with stronger genetic drift in East Asian populations than European populations (Schaffner et al. 2005; Voight et al. 2005). Thus, in addition to the simple constant population-size model, we have simulated bottleneck scenarios compatible with plausible parameter spaces estimated by Voight et al. (2005) for European and East Asian populations. Although other models offer more detailed information about additional demographic features (Schaffner et al. 2005; Gutenkunst et al. 2009; Laval et al. 2010), we chose to use the relatively simple scenarios explored by Voight et al. (2005) because they provide a more straightforward way to assess the impact of population size changes, while remaining compatible with globally observed patterns of genetic variation.
The constant size model assumed an effective population size of Ne = 10,000. Demographic parameters for the European bottleneck simulations included a bottleneck severity (b), of 0.1 for 400 generations (tdur) starting 1,600 generations ago (tstart). The severity of the East Asian bottleneck was b = 0.005 for tdur = 300 generations, starting tstart = 1,600 generations ago (Voight et al. 2005).
Estimation of Sweep Ages and Selection Coefficients
To jointly estimate the selection intensities (s) and the ages of onset of selective sweeps (t), we performed Monte Carlo forward simulations of the trajectories of SNP/microsatellite haplotypes carrying favored SNP alleles, taking genetic drift into account, conditional on the alleles not being lost (the code is available upon request). The simulated haplotypes were designed to match the characteristics of the haplotype systems used in the real data (fig. 1). At the initial state, starting from frequency 1/2Ne, a single derived SNP variant was randomly assigned to an array of linked marker loci defining the chromosomal background in which the mutation originally arose. In each iteration of the simulations, as the frequency of the derived allele increased due to selection, the original haplotype bearing the derived allele was eroded by mutation at the linked microsatellite loci and by recombination with chromosomes bearing the ancestral allele. Selection coefficients (s) were drawn from a uniform prior distribution s (0–1). To account for uncertainty in the mutation rates (µ) at each microsatellite locus, µ values were drawn from a gamma distribution with shape and scale parameters of k = 2 and θ = µ/k, respectively, so that the mean of each distribution corresponded to the value obtained with the homozygosity-based estimator used for neutrality tests (Xu and Fu 2004).
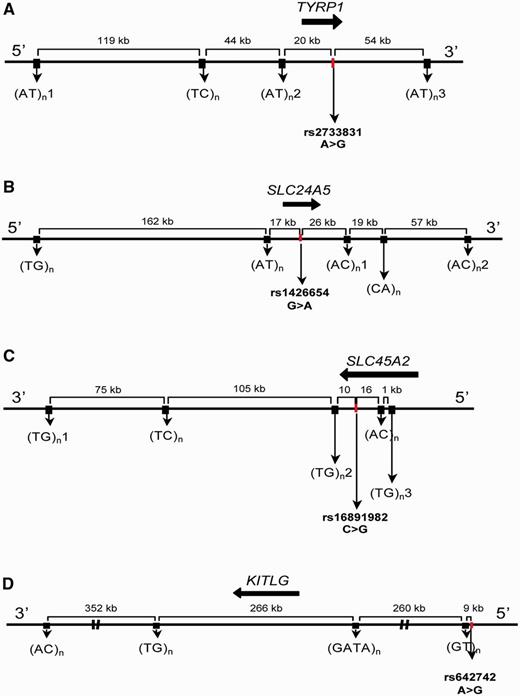
Schematic representation of the genetic intervals including tag-SNPs and microsatellites used to characterize HD. The approximate locations of pigmentation genes are indicated by black arrows. The full characterization of each tag-SNP and microsatellite is reported in supplementary table S1, Supplementary Material online. (A) TYRP1; (B) SLC24A5; (C) SLC45A2; and (D) KITLG.
We did not consider the regeneration of the original haplotype due to reverse mutation in microsatellites, because it is expected to be negligible given the relatively high number of microsatellite loci used to define haplotypes. With this simplification, each microsatellite locus is defined by one of two states, corresponding to the presence or absence of the allele that became originally associated with the derived SNP variant (supplementary text, Supplementary Material online).
For recombination rates, we used fixed values interpolated from the HAPMAP data, as described earlier. To summarize the levels of intra-allelic homogeneity, in each iteration we calculated the proportion of haplotypes bearing the derived allele that preserved the ancestral haplotype (Panc), which is known to be sensitive to mutation age (Stephens et al. 1998). Although we assumed a constant effective population size of 10,000 for most calculations, we have also assessed the effects of population growth using initial Ne values and exponential growth rates (γ) fitting plausible alternative demographic scenarios (supplementary table S2, Supplementary Material online).
To match simulated and observed data, we used a rejection-sampling approach only accepting s and t values from simulations with derived allele frequencies and Panc values within ±2 binomial standard deviations around the observed values. Resampling of accepted simulations using smaller acceptance intervals had no noticeable effect on the estimations (not shown). To calculate Panc values from the data, we assumed that the haplotype combining the modal allele at each microsatellite locus represented the original haplotype (Coelho et al. 2005). The s,t combinations with the highest number of accepted simulations were used as point estimates of selection intensities and times of onset of selective sweeps. All estimates are based on 10,000 accepted simulations and assume an additive or fully dominant fitness effect. Biplots for all s, t pairs displaying highest density regions (HDRs) contours were computed with R (www.r-project.org) using the package hdrcde (Hyndman 1996). A generation was assumed to comprise 28 years (Fenner 2005).
To evaluate the accuracy of the simulation method, we simulated 1,000 pseudodata sets using known t and s parameter values drawn from uniform priors. For each pseudodata set, we reestimated t and s using the same approach employed for the empirical data and calculated the fraction of known values falling within a given HDR (supplementary fig. S1, Supplementary Material online).
Results
Because the most relevant evolutionary events in the history of SLC24A5, SLC45A2, TYRP1, and KITLG are expected to have occurred within a relatively short time scale, we have based our approach on the analysis of relatively long (237–887 kb) haplotypes consisting of several rapidly evolving microsatellites linked to one tag SNP in each gene (fig. 1). We selected tag SNPs based on their previously reported association with measurable effects on pigmentation, location in genomic regions with signs of positive selection, and patterns of interspecies conservation (see Materials and Methods).
As expected, the tag SNP allele frequencies in our samples mirrored previously described distributions in major geographic groups (Lamason et al. 2005; Yuasa et al. 2006; Frazer et al. 2007; Miller et al. 2007; Norton et al. 2007; Soejima and Koda 2007) (table 1). The derived alleles SLC24A5*A and SLC45A2*G both have frequencies higher than 90% in Europeans but are much more rare or absent in Africans and East Asians. The TYRP1*G allele, which is also rare among Africans and East Asians, reaches an intermediate frequency of 60% in Europeans. At the rs642742 SNP, the frequency of the KITLG*G derived allele in Africans is 7%, in contrast to the high frequencies found in Europeans and East Asians (∼80%).
Allele Frequencies of Tag SNPs in Pigmentation Genes Studied in African, East Asian, and European Populations.
| Gene/SNP | Allele | African ± SD | East Asian ± SD | European ± SD |
|---|---|---|---|---|
| SLC24A5/rs1426654 | G | 0.971 ± 0.002 | 0.989 ± 0.008 | 0.007 ± 0.004 |
| A | 0.029 | 0.011 | 0.993 | |
| SLC45A2/rs16891982 | C | 1.00 ± 0.00 | 0.987 ± 0.01 | 0.049 ± 0.01 |
| G | 0.00 | 0.013 | 0.951 | |
| TYRP1/rs2733831 | A | 0.965 ± 0.01 | 0.986 ± 0.01 | 0.415 ± 0.04 |
| G | 0.035 | 0.014 | 0.585 | |
| KITLG/rs642742 | A | 0.932 ± 0.02 | 0.177 ± 0.03 | 0.164 ± 0.03 |
| G | 0.068 | 0.823 | 0.836 |
Patterns of Haplotype Variation
Figure 2 displays the relationships among haplotypes carrying ancestral and derived alleles at pigmentation associated SNPs for each studied gene. The reconstructed SNP/microsatellite haplotypes clearly show that derived alleles at TYRP1, SLC24A5 and SLC45A2 are associated with only subsets of possible haplotypes (fig. 2A–C and supplementary fig. S2, Supplementary Material online). Haplotypes bearing the derived allele at the TYRP1 and SLC24A5 loci (fig. 2A and B) tend to be more tightly clustered than at the SLC45A2 gene (fig. 2C), which displays a more interspersed pattern, probably due to early recombination between ancestral and derived lineages.
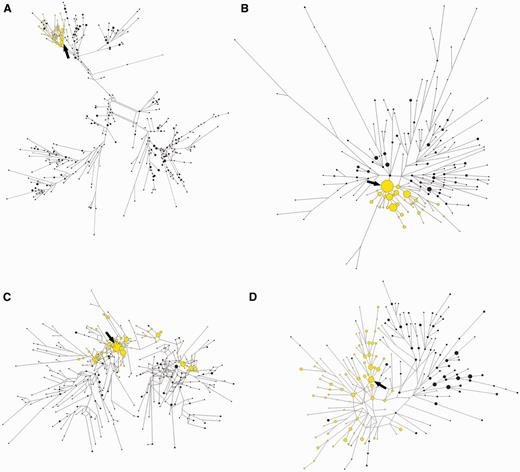
Median-joining networks representing the relationships between compound SNP/microsatellite haplotypes associated with different pigmentation genes. Ancestral (black) and derived (yellow) lineages from the pooled sample of European, East Asian, and African populations are shown. Each circle represents a different haplotype. The area of the circles is proportional to the frequency of the haplotype in the populations. The arrows point to the putative ancestral haplotype of each derived lineage. (A) TYRP1; (B) SLC24A5; (C) SLC45A2; and (D) KITLG.
In contrast with TYRP1, SLC24A5, and SLC45A2, KITLG displays more similar levels of intra-allelic diversity in ancestral and derived lineages (fig. 2D and supplementary fig. S2, Supplementary Material online). Moreover, approximately 58% of chromosomes bearing the KITLG*G allele outside Africa are shared by Europeans and East Asians, suggesting that an important fraction of the KITLG*G intra-allelic variation was generated before the split of European and East Asian populations (supplementary fig. S3, Supplementary Material online).
Neutrality Tests
To test whether the observed patterns of haplotype variation were consistent with neutrality, we performed coalescent simulations under different demographic scenarios to generate null distributions of two summary statistics of microsatellite intra-allelic diversity: the probability of observing two different haplotypes, or HD, and the average variance of repeat number (V) (table 2). For TYRP1, SLC24A5, and SLC45A2, the probabilities of observing two different haplotypes within derived alleles (HD) were consistently lower than expected under neutrality, irrespectively of the demographic scenario (table 2). However, neutrality could not be rejected for SLC45A2 when intra-allelic diversity was measured by the average variance of repeat number (V) at linked microsatellite markers (table 2). This discrepancy is likely to have been caused by the recombinational introgression of microsatellite alleles with very different sizes into the background of the derived SLC45A2*G clade, as reflected in the bimodal allele frequency distributions at the microsatellite loci (TC)n and (TG)n3 (supplementary fig. S2, Supplementary Material online). Alternatively, this pattern is consistent with an early multirepeat microsatellite mutational event on the derived haplotype.
Probabilities of Finding the Observed Levels of Intra-Allelic Diversity within Derived Lineages of Four Pigmentation Genes, Assuming Different Demographic Scenarios under Neutrality.
| Tag SNP | Allele | European Population | East Asian Population | ||||||
|---|---|---|---|---|---|---|---|---|---|
| HDa | Vb | Constc,d | Bottleneckd,e | HD | V | Constc,d | Bottleneckd,e | ||
| rs1426654 | SLC24A5*A | 0.778 | 0.46 | <0.001 | <0.001 | — | — | — | — |
| rs16891982 | SLC45A2*G | 0.963 | 6.90 | <0.001 (HD)f | <0.001 (HD)f | — | — | — | — |
| rs2733831 | TYRP1*G | 0.979 | 7.07 | <0.001 | <0.05 | — | — | — | — |
| rs642742 | KITLG *G | 0.975 | 1.63 | >0.05 | >0.05 | 0.972 | 1.73 | >0.05 | >0.05 |
aHD, probability of drawing two different microsatellite-haplotypes within the derived allele.
bV, average per locus variance in microsatellite repeat number within the derived pigmentation allele.
cConstant demographic model; parameters are as in Materials and Methods section.
dUnless mentioned, P values refer to the two sample statistics (V and HD).
eEuropean bottleneck model and East Asian bottleneck; parameters are as in Materials and Methods section.
fOnly HD was significantly lower than simulated data.
Differently from TYRP1, SLC24A5, and SLC45A2, the levels of intra-allelic diversity at the KITLG locus were compatible with neutrality for all demographic scenarios, in contrast with previously reported signatures of positive selection based on patterns of SNP variation around tag SNP rs642742 (Miller et al. 2007) or in other neighboring regions surrounding the KITLG gene (Lao et al. 2007; Williamson et al. 2007; Pickrell et al. 2009). To evaluate whether the lack of signals of natural selection could be due to a distant location of rs642742 relatively to the true target of selection, we used the available genotype data from HapMap samples to perform selection tests based on the microsatellite variation linked to three additional tag SNPs associated with clear signs of selection at KITLG in European an East Asian populations: 1) rs10732643, located within a target region previously identified by a composite likelihood ratio approach (Williamson et al. 2007); 2) rs3782181, located within a core haplotype centered on the KITLG gene, displaying a significantly high extended haplotype homozygosity (Lao et al. 2007); and 3) rs1881227, previously used to characterize a SNP-based signal of natural selection around KITLG (Coop et al. 2009). Our coalescent-based tests failed to reject neutrality in all cases, showing that that the absence of signals of selection we observe for the rs642742 locus may be a general feature of the KITLG gene when using this test.
Age and Selection Coefficient Estimates
To jointly estimate the magnitude (s) and age (t) of selective sweeps, we used forward Monte Carlo simulations incorporating drift, selection, recombination, and mutation at linked marker loci. The estimates were obtained by matching simulated data to the observed frequencies of the derived alleles and the proportion of derived lineages preserving the original haplotype in which the favored mutation arose (Panc, inversely correlated with intra-allelic diversity). Because the available information from the KITLG, SLC24A5, and SLC45A2 genes suggests that phenotypic effects are consistent with modes of inheritance that are between additive and dominant (Lamason et al. 2005; Miller et al. 2007; Norton et al. 2007), we used these two modes of inheritance to model fitness.
Table 3 presents the modes of the joint distributions of selection coefficients and times of onset of selective sweeps at the KITLG, TYRP1, SLC24A5, and SLC45A2 genes under dominant and additive fitness models, assuming a constant effective population size of 10,000. Estimates for the KITLG*G allele were based on data from either European or East Asian population samples. Estimates for TYRP1*G, SLC24A5*A, and SLC45A2*G were based on data from European samples.
Modal Age (t) and Selection Coefficient (s) Joint Estimates and One-Dimensional 95% Confidence Intervals Based on the 2.5% and 97.5% Percentiles of the Marginal t and s Distributions.
| Tag SNP | Allele | Dominant Model | Additive Model | ||
|---|---|---|---|---|---|
| sa | Age (Years)b | sa | Age (Years)b | ||
| rs1426654 | SLC24A5*A | 0.16 (0.05–0.73) | 18,704 (5,824–38,332) | 0.08 (0.02–0.55) | 11,368 (1,036–55,832) |
| rs16891982 | SLC45A2*G | 0.05 (0.02–0.1) | 15,932 (8,260–31,780) | 0.04 (0.02–0.09) | 13,720 (6,188–26,964) |
| rs2733831 | TYRP1*G | 0.02 (0.006–0.085) | 12,796 (3,388–34,664) | 0.03 (0.01–0.09) | 14,000 (4,788–35,028) |
| rs642742 | KITLG *G-Eurc | 0.02 (0.003–0.073) | 30,212 (5,152–97,188) | 0.02 (0,004–0,091) | 31,164 (5,796–77,900) |
| rs642742 | KITLG *G-EAsid | 0.01 (0.003–0.087) | 31,836 (4,872–102,340) | 0.02 (0.004–0.091) | 30,940 (5,824–94,780) |
Note.—Plots reporting two-dimensional credible regions for the t and s parameters are reported in figure 3.
aSelection coefficient.
bAssuming a generation interval of 28 years (Fenner 2005).
cKITLG *G lineages sampled in the European population.
dKITLG *G lineages sampled in the East Asian population.
For illustrative purposes, table 3 also provides one-dimensional 95% confidence intervals based on the 2.5% and 97.5% percentiles of the marginal distributions of t and s. However, because of the strong correlation between the estimated parameters, other intervals with 95% coverage may be defined, whose limits can be less wide than those presented in table 3. Therefore, we additionally calculated two-dimensional credible sets based on HDRs (Hyndman 1996) rather than focusing exclusively on confidence intervals for individual parameters (fig. 3).
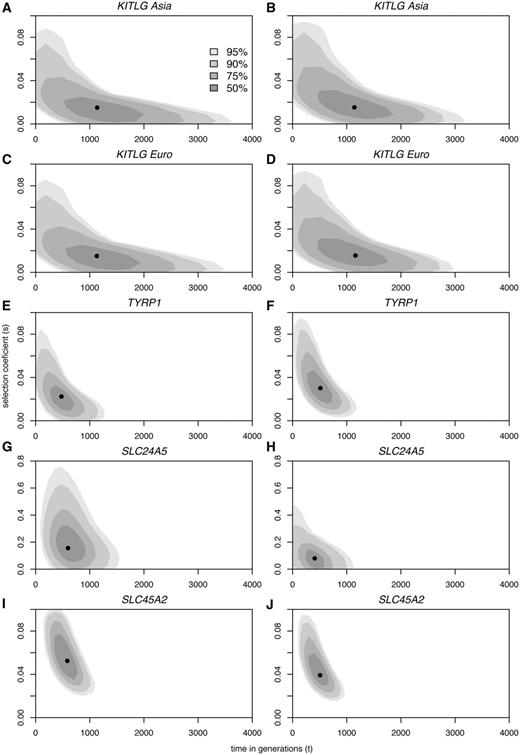
Biplots of the posterior densities of the times of onset of selective sweeps in generations (x axes) and selection coefficients (y axes), at each of four tag SNPs at the KITLG (A–D), TYRP1 (E,F), SLC24A5 (G,H), and SLC45A2 (I,J) loci, assuming dominant (A, C, E, G, I) and additive (B, D, F, H, J) models of selection. The mode is marked by a black dot. Shades of gray with decreasing intensity indicate 50, 75, 90, and 95% HDR.
The accuracy of the simulation method was evaluated by assessing the ability to recover known t and s values obtained from 1,000 simulated pseudodata sets (see supplementary fig. S1, Supplementary Material online and Materials and Methods for details). We found that in 98% of the simulations, the known parameter values fell within the range of the 95% HDR of the estimates.
The modes for the age and selection intensity of KITLG sweeps using rs642742 estimated from European and Asian samples with the two models of inheritance were strikingly concordant (t ∼30,000–32,000 years; s ∼0.01–0.02; table 3). Age calculations using alternative KITLG tag SNPs varied on average approximately 30% and 21% around estimates based on rs642742 (supplementary table S3, Supplementary Material online), assuming dominant and additive models, respectively. The nonzero estimates for selection coefficients at KITLG (table 3) contrast with the nonsignificant values obtained with our neutrality tests (table 2) but are consistent with scans for selection based on SNPs (McEvoy et al. 2006; Lao et al. 2007; Miller et al. 2007; Williamson et al. 2007; Pickrell et al. 2009). Thus, it is likely that the nonsignificant values may simply reflect the limited power of our neutrality test to detect selective sweeps due to the added effects of recombination and high microsatellite mutation rates, which favor the rapid recovery of intra-allelic variation (Wiehe 1998). As the ability to detect selective sweeps with neutral microsatellites is inversely related with the time since fixation of a linked favorable allele (Wiehe 1998), this conclusion is also supported by the substantially older estimates of sweep ages at KITLG than at SLC24A5, TYRP1, and SLC45A (table 3), all three with significant neutrality tests (table 2).
The modes of the age estimates at SLC24A5, TYRP1, and SLC45A2 are consistently found at ∼11,000–19,000 years, under the dominant and additive fitness models (table 3). The intensity of selection estimated for the SLC24A5 locus, ranging from 0.16 in the dominant model to 0.08 under the more realistic additive model (Lamason et al. 2005), is considerably higher than at TYRP1 (s = 0.02–0.03) and SLC45A2 (s = 0.04–0.05). It is noteworthy that estimated selective coefficients at KITLG, SLC45A2, and SLC24A5 are consistent with their previously measured effects on skin pigmentation in admixed populations: 2.8–3.8, 5, and 7.6–11.4 average melanin units at KITLG (Miller et al. 2007), SLC45A2 (Norton et al. 2007), and SLC24A5 (Lamason et al. 2005), respectively. However, we note that these studies on admixed populations used a small number of ancestry informative markers to correct for admixture stratification. Hence, although the direction of strength of the alleles might be correct, the size of the effect of the genes could be overestimated.
To assess the effects of population growth on the parameter estimates, we have additionally performed simulations matching the demographic conditions of the recovering phase from a bottleneck scenario in European populations (supplementary table S2, Supplementary Material online; see Materials and Methods). In accordance with previous studies on other highly favored alleles (Tishkoff et al. 2001, 2007; Ohashi et al. 2004), the modified demographic conditions did not strongly affect the simulation results, with t and s varying on average approximately 18% and 4% of the size of estimates obtained assuming constant population size, under the dominant and the additive models, respectively.
Discussion
We have characterized the patterns of microsatellite-HD at four genes influencing normal pigmentation variation to evaluate the time frame over which European populations evolved lighter pigmentation.
Our results based on the KITLG gene suggest that the initial stages of European skin lightening occurred in a proto-Eurasian population, approximately 30,000 years ago, after the out-of-Africa migration ∼60,000–70,000 years ago (Schaffner et al. 2005; Mellars 2006; Keinan et al. 2007; Laval et al. 2010; Rasmussen et al. 2011) and slightly more recently than the earliest archaeological evidences for the dispersal of anatomically modern humans in Europe, approximately 40,000 years ago (Klein 1999; Mellars 2006). Recent estimates based on genome-wide patterns of variation have suggested that the European and East Asian divergence might have occurred as late as ∼25,000 years ago (Keinan et al. 2007; Gutenkunst et al. 2009; Laval et al. 2010; Rasmussen et al. 2011), implying that the colonization of Europe could have involved several migration movements at different ages (Laval et al. 2010). Our estimates for the onset of selection at KITLG are consistent with these findings, although more ancient dates (>40,000 years) cannot be excluded, due to uncertainty of age estimates. In any case, both the modal age estimates (table 3) and the extensive sharing of derived lineages between European and East Asian populations (supplementary fig. S3, Supplementary Material online) suggest that the onset of the KITLG sweep occurred before the divergence of the ancestors of present-day Europeans and East Asians, well after modern humans left Africa.
Our estimates additionally show that the onset of selective sweeps at SLC24A5, SLC45A2, and TYRP1, the three genes in which the geographic distribution of the polymorphisms is primarily restricted to European populations, was much more recent than at KITLG and remarkably compressed within the last 11,000–19,000 years (table 3), suggesting that lighter pigmentation alleles at these three loci began to rise in frequency only in the latest phases of the Upper Paleolithic, encompassing the Solutrean and the Magdalenian cultures. One prior study has similarly suggested that the selective sweep at the SLC45A2 occurred long after the arrival of anatomically modern humans in Europe (Soejima et al. 2006).
Although the timing of the selective sweep(s) is clear from these analyses, it is less clear whether the genetic variants underlying this adaptive response originated in Eurasia or were already present in Africa before the ancestors of contemporary non-Africans left the continent. Previous studies using several population samples from different continents have shown that, unlike SLC45A2, derived alleles at SLC24A5, TYRP1, and KITLG are present at low frequencies in some sub-Saharan populations (table 1, see also Yuasa et al. 2006; Frazer et al. 2007; Norton et al. 2007; Soejima and Koda 2007; Coop et al. 2009; Pickrell et al. 2009). We see three possible explanations for these patterns: 1) the derived alleles arose in Europe (for SLC24A5 and TYRP1) or in the ancestral Eurasian population (for KITLG) where they increased in frequency and were introduced later into Africa by gene flow, 2) the derived alleles arose in Africa, where they remain at low frequencies and spread out of Africa with the early migrations of modern humans. These alleles were then lost from the ancestral gene pools of East Asians (except for KITLG) and ultimately increased in frequency in the ancestors of Europeans, and 3) the African and European alleles had independent mutational origins and are homoplastic, which is an unlikely scenario. It would be necessary to carry out a more exhaustive study of the diversity of these loci, and particularly, the pattern of intra-allelic variation for the derived alleles in African and Eurasian populations, to clarify these issues.
In any case, the SNP-haplotype structure around the derived alleles at all loci bear signals of Eurasian hard sweeps that are not expected under selection from standing variation (Hermisson and Pennings 2005; Izagirre et al. 2006; McEvoy et al. 2006; Soejima et al. 2006; Voight et al. 2006; Lao et al. 2007; Myles et al. 2007; Norton et al. 2007; Sabeti et al. 2007; Williamson et al. 2007; Pickrell et al. 2009).
In this setting, which are the most important factors that influenced the sorting of pigmentation variants among different populations? Recently, it has been suggested that the geographic spread of selected variants essentially depends on the timing of selective sweeps relative to major population movements (Coop et al. 2009). Our sweep age estimates for KITLG, SLC24A5, SLC45A2, and TYRP1 are consistent with this interpretation, because the onset of the Eurasian-wide sweep at KITLG precedes the split of Europeans and East Asians, whereas the European-specific sweeps at SLC24A5, SLC45A2, and TYRP1 started well after the separation of European populations. However, it is important to understand what factors might have led to the temporal patterns revealed by our estimates.
The period encompassing the onset of the SLC24A5, SLC45A2, and TYRP1 sweeps, between 11,000 and 19,000 years ago, falls within the oxygen-isotope climatic stage 2 (OIS-2), which lasted from 24,000 to 12,000 years ago and comprised the last glacial maximum (LGM), approximately 15,000–20,000 years ago (Klein 1999). As previously emphasized (Jablonski and Chaplin 2000), it is likely that the climatic conditions prevailing during the last glaciation favored cultural modifications that limited exposure to UVR, like shelter seeking and the wearing of more protective clothing. Moreover, seasonality (differences in solar radiation between the summer and the winter) is thought to have significantly increased from 18,000 to 10,000 years ago, extending the duration “vitamin D winters” and augmenting the risks of vitamin D insufficiency (COHMAP Consortium 1988; Gamble and Soffer 1990; Jablonski 2004; Parra 2007). Additionally, it is conceivable that population growth after the LGM was also an important factor in the onset of the selective sweeps observed for these three genes in Europe. As previously noted (Hawks et al. 2007; Karasov et al. 2010; Pritchard et al. 2010), effective population size is one of the most important factors limiting the availability of adaptive mutations. Because of this limiting effect, it has been proposed that the rate of adaptive evolution in humans before 50,000 years was relatively low, starting to increase only with the onset of population growth in the Upper Paleolithic and its subsequent magnification during the Neolithic (Hawks et al. 2007). In Eurasia, it is likely that demographic limits to adaptation were prolonged by bottlenecks affecting populations migrating out of Africa (Schaffner et al. 2005; Voight et al. 2005; Laval et al. 2010), and this could explain, in combination with weaker selection pressures related to UVR availability in the ancestral Eurasian population, the presence of very few skin-lightening alleles shared between Europeans and East Asians (McEvoy et al. 2006), of which the derived KITLG lineage is the best-known example. On the contrary, during the 11,000–19,000 years period over which selective sweeps at SLC24A5, SLC45A2, and TYRP1 started, effective population sizes could have been high enough for advantageous mutations to accumulate in relatively short time at different loci contributing to light pigmentation. In support of this view are archeological data indicating that there was a significant increase in population sizes in Europe at the Magdalenian (16,500–11,500 years ago) (Bocquet-Appel and Demars 2000; Bocquet-Appel et al. 2005). Moreover, the fact that the sweeps at SLC24A5, SLC45A2, and TYRP1 occurred well after the divergence of Europeans and East Asians increased the chance of convergent adaptation by shortening the delay between local adaptive mutations relative to the time necessary for advantageous variants to spread across Eurasia (Ralph and Coop 2010).
Recent theoretical work (Ralph and Coop 2010) has shown that independent evolution may be an important determinant of geographic patterns of adaptation and could explain the observed scarcity of continental-wide sweeps in human populations (Coop et al. 2009; Pickrell et al. 2009), even when selective pressures are homogeneous. In this framework, the temporal patterns reported here for pigmentation lightening are likely to be far from unique and may be exhibited by a substantial proportion of other recently evolved traits.
Acknowledgments
The authors thank José Pimentel and the Government of Namibe for the Angolan samples, and António Prista and all colleagues of the Human Biological Variability in Mozambique project for the Mozambican samples. They also acknowledge Nuno Ferrand for helpful discussions. This work was supported by Fundação para a Ciência e a Tecnologia (FCT) to S.B. and J.R. (PPCDT/BIA-BDE/56654/2004, PTDC/BIA-BDE/64044/2006, and PTDC/BIA-BDE/68999/2006) and National Institute of Health-National Human Genome Research Institute (NIH NHGRI) to M.D.S. (HG002154). E.J.P. has received research support from the Natural Sciences and Engineering Research Council of Canada (NSERC); the Canada Foundation for Innovation (CFI); the Ontario Innovation Trust (OIT); and the Government of Ontario Early Research Award (ERA). S.B. and I.A. were supported by FCT (SFRH/BPD/21887/2005 and PTDC/BIA-BDE/68999/2006, respectively).
References
Author notes
†Present address: Department of Genetics, Stanford University
‡Present address: Computational and Molecular Population Genetics Lab, Institute of Ecology and Evolution, University of Bern, Switzerland
§Present address: Plant Stress Signaling Unit, Instituto Gulbenkian de Ciência, Oeiras, Portugal
Associate editor: Matthew Hahn
