


Abstract
Several isolates of the marine cyanobacterial genus Prochlorococcus have smaller genome sizes than those of the closely related genus Synechococcus. In order to test whether loss of protein-coding genes has contributed to genome size reduction in Prochlorococcus, we reconstructed events of gene family evolution over a strongly supported phylogeny of 12 Prochlorococcus genomes and 9 Synechococcus genomes. Significantly, more events both of loss of paralogs within gene families and of loss of entire gene families occurred in Prochlorococcus than in Synechococcus. The number of nonancestral gene families in genomes of both genera was positively correlated with the extent of genomic islands (GIs), consistent with the hypothesis that horizontal gene transfer (HGT) is associated with GIs. However, even when only isolates with comparable extents of GIs were compared, significantly more events of gene family loss and of paralog loss were seen in Prochlorococcus than in Synechococcus, implying that HGT is not the primary reason for the genome size difference between the two genera.
Introduction
The best known examples of genome size reduction in bacteria are found in intracellular endosymbionts of insects such as Buchnera and Wigglesworthia and in obligatory intracellular pathogens of vertebrates such as Mycoplasma genitalium and Mycobacterium leprae (Moran and Mira 2001; Vissa and Brennan 2001; Marais et al. 2008; Delaye and Moya 2010; Gosalbes et al. 2010; Burke and Moran 2011). Certain genomes of the marine cyanobacterium Prochlorococcus provided the first known example of a free-living bacterium with a relatively small genome (Dufresne et al. 2005). More recently, a free-living marine heterotrophic bacterium, Pelagibacter, was also shown to have a small genome (Giovannoni et al. 2005), as do extracellular symbionts of insects (Kikuchi et al. 2009).
In the case of intracellular symbionts and pathogens, a major factor in genome size reduction may be the relaxation of purifying selection resulting from an intracellular lifestyle; the fact that host proteins can perform certain functions formerly encoded by deleted bacterial genes may render mutations inactivating certain bacterial genes selectively neutral or nearly so (Dagan et al. 2006). In addition, intracellular symbionts and pathogens are assumed to have small effective population sizes as a result of frequent population bottlenecks; consequently, genetic drift can lead to fixation of slightly deleterious mutations (Moran and Wernegreen 2000; Woolfit and Bromham 2003). The genome sizes of certain Prochlorococcus isolates are substantially smaller than those of other Prochlorococcus isolates as well as isolates from the related genus Synechococcus, and thus, it has generally been assumed that certain Prochlorococcus lineages have undergone genome size reduction. On the other hand, it has generally been assumed that the evolutionary mechanisms involved in genome size reduction in Prochlorococcus must be different from those involved in intracellular symbionts and pathogens (Kuo and Ochman 2009). Although there is little direct evidence regarding the effective population sizes of free-living marine bacteria such as Prochlorococcus and Pelagibacter, it has often been assumed that populations of these bacteria are very large, decreasing the likelihood of fixation of slightly deleterious mutations (Dufresne et al. 2005, 2008).
One hypothesis is that natural selection has favored the loss of all but the most necessary genes in Prochlorococcus because the marine environment is poor in the elements N and P, needed for DNA synthesis (Dufresne et al. 2005; Giovannoni et al. 2005). Alternatively, because genome size is correlated with cell size, genome reduction may have occurred in the process of evolving a small cell volume, which may be advantageous in avoiding predation by bacterivores and/or increasing surface-to-volume ratio for uptake of scarce nutrients (Giovannoni et al. 2005; Yooseph et al. 2010). As a nonselective alternative, it has been proposed that gene loss in Prochlorococcus has resulted from an increased mutation rate (Marais et al. 2008). However, reported evidence of an increased rate of nonsynonymous substitution in Prochlorococcus (Dufresne et al. 2005) may also be explained by inefficient purifying selection, perhaps implying that effective population sizes of these bacteria are not as large as has been supposed. On the other hand, another study found no evidence of enhanced nonsynonymous substitution in Prochlorococcus, arguing against the hypothesis of inefficient purifying selection and small effective population size (Hu and Blanchard 2009).
In multicellular eukaryotes, genome size differences among species are often due mainly to the extent of DNA repeats (Lynch and Conery 2000; Hughes and Piontkivska 2005). Because DNA repeats and other noncoding sequences are generally rare in bacterial genomes, the size of a bacterial genome depends mainly on the number of genes (Kuo and Ochman 2009). Bacterial gene number in turn results from the effects of two counteracting processes: gene loss by deletion and gene gain by horizontal gene transfer (HGT) or, more rarely, gene duplication (Lerat et al. 2005; Treangen and Rocha 2011). Although gene families tend to be smaller in prokaryotes than in eukaryotes, it is nonetheless true that in bacteria there is a strong positive correlation between genome size and gene family size (Hughes et al. 2005), highlighting the importance of gain and loss of paralogs within gene families in genome evolution even of bacteria.
A previous study reconstructed numerous events of both gene loss and gene gain across the Prochlorococcus phylogeny (Kettler et al. 2007). Such evidence suggests the possibility that the smaller genome sizes found in certain Prochlorococcus isolates than in Synechococcus may be due at least in part to gene gain in the latter rather than gene loss in the former. In addition, there is evidence that genes gained by HGT are not randomly distributed in Prochlorococcus and Synechococcus genomes but rather are confined to genomic islands (GIs) (Coleman et al. 2006; Kettler et al. 2007; Dufresne et al. 2008; Scanlan et al. 2009), which are large inserts of DNA containing a number of functionally related genes putatively acquired by HGT (Vernikos and Parkhill 2006). However, no study has examined the role of the expansion and contraction of gene families as contributing factors to genome size evolution in these bacteria. Here, we test the following related hypotheses: 1) that the smaller genome size of certain Prochlorococcus isolates in comparison to Synechococcus results from gene loss in the former rather than gene gain in the latter and 2) that both loss of entire gene families and deletion of paralogs within multigene families have contributed to genome size reduction in Prochlorococcus.
Materials and Methods
Genome Annotation
The whole genomic DNA sequences of 12 Prochlorococcus strains, that is, P. MIT9301 (CP000576), P. MIT9215 (CP000825), P. AS9601 (CP000551), P. MIT9312 (CP000111), P. MIT9515 (CP000552), P. MED4 (BX548174), P. NATL1A (CP000553), P. NATL2A (CP000095), P. SS120 (AE017126), P. MIT9211 (CP000878), P. MIT9313 (BX548175), P. MIT9303 (CP000554), and 9 nondiazotrophic Synechococcus strains, that is, S. WH8102 (BX548020), S. CC9605 (CP000110), S. CC9902 (CP000097), S. WH7803 (CT971583), S. CC9311 (CP000435), S. RCC307 (CT978603), S. PCC7942 (CP000100), S. PCC6301 (AP008231), S. PCC7002 (CP000951), were downloaded from NCBI and annotated by RAST Server (Aziz et al. 2008; Luo et al. 2008). Using Perl scripts, the predicted protein-coding gene translations with their genomic position and orientation were parsed.
Ortholog Identification and Core Gene Concatenation Tree Reconstruction
Every possible pair of proteomes in the 21 cyanobacteria was assembled with a reciprocal all-versus-all BlastP search (Altschul et al. 1997) using an expectation value of 0.1. The output file was formatted along with information on gene position and orientation. Then the MSOAR software (Chen et al. 2005; Jiang 2007) identified shared orthologs in each pair of genomes. MSOAR is a two-step procedure, by first grouping sequences based upon their similarity and then identifying orthologs using genome context information. Because MSOAR identifies shared orthologs between two genomes, we randomly picked up one genome as a reference and then identified the shared orthologs between the reference genome and each of the remaining 20 genomes. Afterward, we took the intersection of all the pairwise ortholog sets in order to obtain the core gene set of orthologs shared by each of the 21 genomes. The above ortholog identification procedure has been used in previous studies (Luo et al. 2009, 2010).
We aligned all protein products of the core gene set using ClustalW2 software (Larkin et al. 2007), concatenated these amino acid sequences, deleted the aligned sites with gaps, and constructed a maximum likelihood phylogenetic tree using RAxML 7.0.4 (Stamatakis 2006) with the “PROTGAMMAWAGF” model which assumes amino acid substitution rate among sites follows gamma distribution (alpha = 0.55). Four Synechococcus genomes (S. RCC307, S. PCC7942, S. PCC6301, S. PCC7002) were used as an outgroup to root the tree. This rooting was based on a previously published EDE (Wang et al. 2006) inversion distance-based gene order phylogeny of Prochlorococcus and Synechococcus using a distantly related terrestrial cyanobacterium, Gloeobacter violaceus, as an outgroup (Shi and Falkowski 2008), and is consistent with a published sequence-based phylogeny (Kettler et al. 2007).
Gene Families
BLASTCLUST software (Altschul et al. 1997) identified gene families in the Prochlorococcus and Synechococcus genomes. This program clusters similar sequences using single-linkage method so that each sequence is assigned to only one family. As search criteria, we used at least 30% sequence similarity across a minimum of 50% of their length with a conservative E-value of 10−6. In this way, all predicted proteins in the 21 genomes were assigned to gene families. These relatively relaxed criteria were used in order to identify as many homologous gene families as possible (Hughes and Friedman 2008) between Prochlorococcus and Synechococcus.
We defined a gene family as an ancestor-derived family if it included at least one member in any of the outgroup genomes (S. RCC307, S. PCC7942, S. PCC6301, S. PCC7002) and in at least one of the remaining (ingroup) genomes. There were a total of 1,872 ancestor-derived families. Given the phylogenetic tree, the maximum parsimony method (Swofford 2003) was used to reconstruct changes in gene family presence or absence and in paralog number. The data were analyzed in two ways: 1) A binary coding scheme was used such that, for each family, each genome was coded with 1 (presence) or 0 (absence). These data were used to reconstruct events of gain and loss of gene families. 2) The number of paralogs in each family was used as a cladistic character, and changes in paralog number (gain or loss) along branches of the phylogenetic tree were reconstructed. Analyses of reconstructed numbers of losses and gains of paralogs were restricted to branches for which the family was reconstructed to be present in both the ancestor and descendant genomes. In both kinds of analysis, no assumption was made regarding the direction that evolution might take because gene families might be gained by HGT as well as by inheritance from a common ancestor.
GIs Prediction
ALIEN HUNTER software (Vernikos and Parkhill 2006) identified horizontally gained DNA in Prochlorococcus and Synechococcus. The software exploits nucleotide compositional bias using variable order motif distributions, which outperforms fixed-order methods. In addition, it applies Hidden Markov model to predict the optimal localization of the boundaries of each predicted region (Vernikos and Parkhill 2006). Coleman et al. (2006) identified GIs in Prochlorococcus by interruptions in synteny between closely related strains, but their method may have limitations in finding GIs in Synechococcus, in which synteny is much less conserved (Scanlan et al. 2009). In other studies, GIs in Synechococcus were identified by deviation in trinucleotide (3mers) or tetranucleotide (4mers) frequency (Palenik et al. 2006; Dufresne et al. 2008). Vernikos and Parkhill (2006) suggested that low-order compositional indices may not provide sufficient discriminating power in the genomic regions with bias in motifs of higher order (e.g., 6mers). They developed the ALEIN HUNTER software using variable order k-mers, in which both high- and low-order k-mers are used in GI prediction (Vernikos and Parkhill 2006). This variable order method is superior to the methods based upon fixed order k-mers (Vernikos and Parkhill 2006).
Results
Phylogenetic Analysis
Table 1 shows genome sizes and numbers of predicted protein-coding genes of the 21 genomes used in analyses. Among Prochlorococcus genomes, P. MIT9303 and P. MIT9313 were distinctive in having genome sizes and gene numbers comparable to Synechococcus isolates (table 1). In the phylogenetic tree, all branches were well supported (with 100% bootstrap support; fig. 1). In the following, we designate as the ingroup all sequences except for the four outgroup Synechococcus genomes (S. RCC307, S. PCC7942, S. PCC6301, S. PCC7002) (fig. 1). Note that, in addition to the outgroup Synechococcus, there were five Synechococcus genomes in the ingroup (fig. 1). In the phylogenetic tree, the Prochlorococcus isolates formed a monophyletic group; and the two Prochlorococcus isolates with large genomes (P. MIT9303 and P. MIT9313) formed a clade that clustered outside the clade of other Prochlorococcus isolates (fig. 1).
Genome Size and GIs in 21 Cyanobacterial Genomes.
| Genome | Genome Size (bp) | Number of Protein-Coding Genes | GI Numbera | GI Length (bp)b | GI (%) |
| P. AS9601 | 1,669,886 | 1,921 | 48 | 413,698 | 24.8 |
| P. MED4 | 1,657,990 | 1,960 | 1 | 5,436 | 0.3 |
| P. MIT9211 | 1,688,963 | 1,855 | 54 | 514,099 | 30.4 |
| P. MIT9215 | 1,738,790 | 1,983 | 2 | 11,999 | 0.7 |
| P. MIT9301 | 1,641,879 | 1,907 | 1 | 5,042 | 0.3 |
| P. MIT9303 | 2,682,675 | 2,997 | 110 | 1,301,019 | 48.5 |
| P. MIT9312 | 1,709,204 | 1,962 | 2 | 12,006 | 0.7 |
| P. MIT9313 | 2,410,873 | 2,915 | 89 | 970,427 | 40.3 |
| P. MIT9515 | 1,704,176 | 1,906 | 1 | 4,911 | 0.3 |
| P. SS120 | 1,751,080 | 1,882 | 43 | 398,200 | 22.7 |
| P. NATL1A | 1,864,731 | 2,193 | 57 | 532,219 | 28.5 |
| P. NATL2A | 1,842,899 | 2,163 | 63 | 615,278 | 33.4 |
| S. CC9311 | 2,606,748 | 2,892 | 48 | 506,162 | 19.4 |
| S. CC9605 | 2,510,659 | 2,638 | 31 | 315,987 | 12.6 |
| S. CC9902 | 2,234,828 | 2,304 | 25 | 312,447 | 14.0 |
| S. RCC307 | 2,224,914 | 2,535 | 18 | 169,754 | 7.6 |
| S. WH7803 | 2,366,980 | 2,533 | 15 | 128,180 | 5.4 |
| S. WH8102 | 2,434,428 | 2,519 | 28 | 332,882 | 13.7 |
| S. PCC7942 | 2,695,903 | 2,611 | 40 | 348,055 | 12.9 |
| S. PCC7002 | 3,008,047 | 2,823 | 41 | 342,902 | 11.4 |
| S. PCC6301 | 2,696,255 | 2,525 | 33 | 275,001 | 10.2 |
| MIT9303/MIT9313 clade mean (±SE) | 2.54 (±0.14) × 106 | 2956 (±41) | 99.5 (±10.5) | 1.14 (±0.17) × 106 | 44.4 (±4.1) |
| Other Prochlorococcus mean (±SE) | 1.73 (±0.02) × 106 | 1973 (±36) | 27.2 (±8.8) | 2.51 (±0.83) × 105 | 14.2 (±4.7) |
| Synechococcus mean (±SE) | 2.53 (±0.08) × 106 | 2598 (±58) | 31.0 (±3.6) | 3.03 (±0.36) × 105 | 11.9 (±1.3) |
The number of GIs in a given genome.
The total length of GIs in a given genome. GIs were predicted by ALIEN HUNTER software (Vernikos and Parkhill 2006).
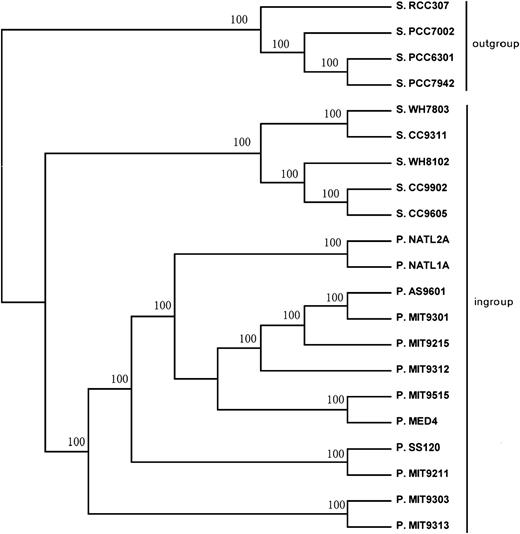
ML tree (topology only) of Prochlorococcus (P.) and Synechococcus (S.) genomes used in analyses. Numbers on the branches represent the percentage of 100 bootstrap samples supporting the branch.
Loss and Gain of Gene Families
We identified 10,403 gene families present in at least one of the 21 Prochlorococcus and Synechococcus genomes. Within the 10,403 families, 5,889 were singleton gene families, each of which was found in just one of the 21 cyanobacterial genomes but with no homologs in any of the other 20 genomes. Such singleton families may result from errors in gene annotation (Veloso et al. 2005; Sammut et al. 2008), but in some cases, they may represent genes transferred by recent HGT to one of the genomes. Of the remaining families, 1,872 were classified as ancestor-derived families, each of which included at least one member in any of the ingroup clade genomes and at least one member in any of the outgroup genomes (fig. 1).
Figure 2 illustrates numbers of reconstructed gains and losses of entire ancestor-derived genes families in the phylogeny of the ingroup Prochlorococcus and Synechococcus genomes. There were a total of 1,173 gene family loss events and 258 gene family gain events in Prochlorococcus, for a losses-to-gains ratio of 4.54. By contrast, there were 266 gene family loss events and 273 gene family gain events in Synechococcus, for a losses-to-gains ratio of 0.97. The difference between the ratios was highly significant (χ2 = 211.3; 1 degree of freedom [df]; P < 0.001).
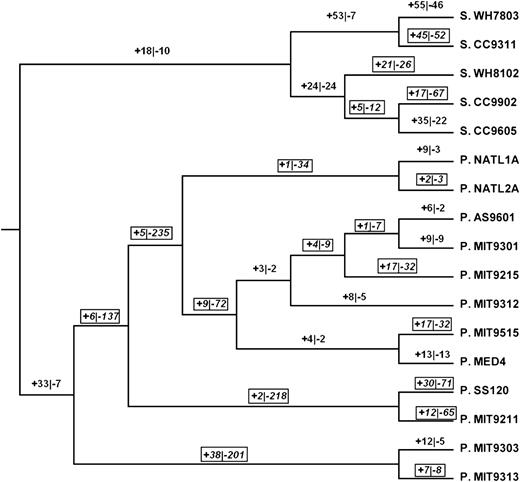
Numbers of reconstructed events of gain (+) and loss (-) of entire gene families in the ingroup phylogeny (based on fig. 1). “Boxes” indicate branches on which losses exceed gains.
Interestingly, in spite of the large genome sizes of the P. MIT9303/P. MIT9313 clade, the branch ancestral to that showed a substantial number of gene family losses (201), greatly exceeding the number of gene family gains (only 38; fig. 2). In the P. MIT9303/P. MIT9313 clade (including the branch ancestral to the clade), there were 214 gene family loss events and 57 gene family gain events, for a losses-to-gains ratio of 3.75. The latter ratio was lower than that in the remainder of Prochlorococcus, where the losses-to-gains ratio was 959:201 or 4.77. However, the latter two ratios did not differ significantly (χ2 = 2.04; 1 df; not significant).
A total of 658 families were lost at least once in the ingroup genomes (supplementary table S1, Supplementary Material online). For these 658 families, the mean number of loss events in Prochlorococcus was 1.75 ± 0.03 standard error (SE), and the median number of loss events was 2.0. For the same families, the mean number of loss events in Synechococcus was 0.40 ± 0.02 SE, and the median number of loss events was 0.0. The difference between Prochlorococcus and Synechococcus was highly significant by both parametric (paired t-test; P < 0.0001) and nonparametric (Wilcoxon test; P < 0.001) tests. There were 321 families that were gained at least once in one of the two genera. In these families, the mean number of gain events in Prochlorococcus was 0.78 ± 0.05 (median = 1.00), whereas in Synechococcus, the mean number of gain events was 0.85 ± 0.04 (median = 1.00). In contrast to losses, there was not a significant difference in either mean (paired t-test) or median (Wilcoxon test) number of gains between the two genera.
The set of families lost in the P. MIT9303/P. MIT9313 clade was strikingly different from those lost in other Prochlorococcus. Of the 658 families lost at least once in the ingroup genomes, 193 were lost at least once in both the P. MIT9303/P. MIT9313 clade and in other Prochlorococcus. Only 21 of these families were lost at least once in the P. MIT9303/P. MIT9313 clade but not in other Prochlorococcus, whereas 386 families were lost at least once in other Prochlorococcus but not in the P. MIT9303/P. MIT9313 clade.
Loss and Gain of Paralogs
We reconstructed gains and losses of paralogs in the ancestor-derived families along branches for which a given family was reconstructed as present in both the ancestral and descendant genomes (fig. 3). In the ingroup Synechococcus genomes, there was only one branch in which the number of paralogs lost exceeded the number of paralogs gained, whereas in Prochlorococcus, there were seven branches in which the number of paralogs lost exceeded the number of paralogs gained (fig. 3). In ingroup Synechococcus, there were 269 paralogs gained as compared with 96 paralogs lost, yielding a gain:loss ratio of 2.8 (fig. 3). In Prochlorococcus other than the P. MIT9303/P. MIT9313 clade, there were 225 paralogs gained as compared with 272 paralogs lost, yielding a gain:loss ratio of 0.8. The latter ratio differed significantly from that of Synechococcus (χ2 = 69.5; 1 df; P < 0.001). By contrast, in the P. MIT9303/P. MIT9313 clade, there were 174 paralogs gained and 52 lost, yielding a gain:loss ratio of 3.3. The latter ratio was not significantly different from that of Synechococcus (χ2 = 0.81; 1 df; not significant) but was significantly different from that of other Prochlorococcus (χ2 = 63.2; 1 df; P < 0.001). In the individual branches of the phylogeny, there was a strong positive correlation between the number of paralogs lost within families and the number of families lost (r = 0.900; P < 0.001; fig. 4A).
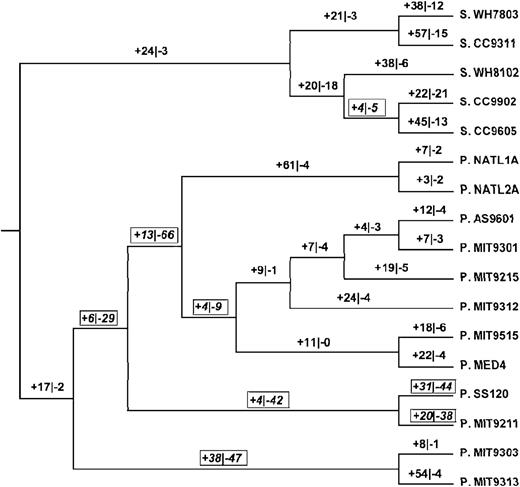
Numbers of reconstructed events of gain (+) and loss (-) of paralogs in gene families in the ingroup phylogeny (based on fig. 1). Boxes indicate branches on which losses exceed gains.
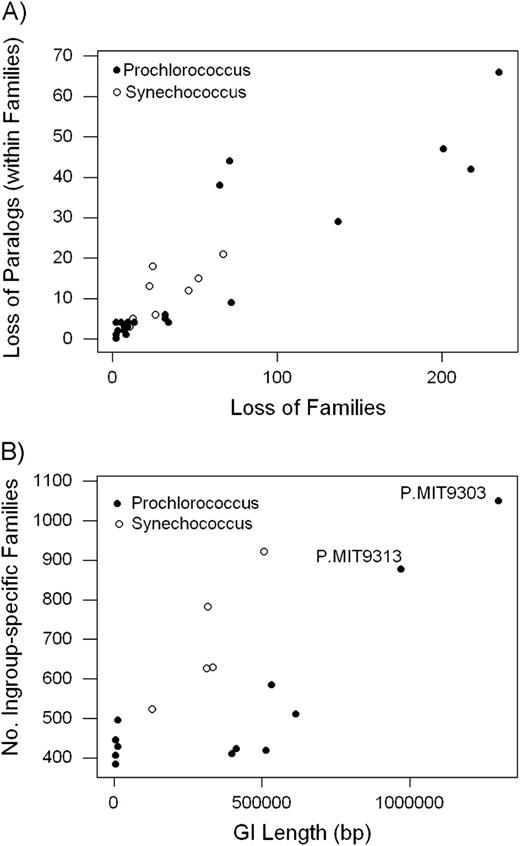
(A) Relationship between number of paralogs lost within families and number of families lost in phylogeny of Prochlorococcus (solid circles) and Synechococcus (open circles); r = 0.900; P < 0.001. (B) Relationship between the number of ingroup-specific families and GI length in Prochlorococcus (solid circles) and Synechococcus (open circles); r = 0.741; P = 0.001.
Ingroup-Specific Families
There were 6,027 families that were found in one or more of the ingroup clade genomes but not in the outgroup, which we here designate ingroup-specific families (table 2). Of these families, 1,520 (25.2%) were present in one or both members of the P. MIT9303/P. MIT9313 clade (table 2). Of the families that were absent from the P. MIT9303/P. MIT9313 clade, fairly high proportions were absent from the Synechococcus ingroup clade (55.9%; table 2) or from the clade of other Prochlorococcus (44.8%; table 2). However, of the ingroup-specific families present in the P. MIT9303/P. MIT9313 clade, very few were also present either in the Synechococcus ingroup or other Prochlorococcus (table 2). Of the 1,520 ingroup-specific families present in the P. MIT9303/P. MIT9313 clade, only 155 were present in the Synechococcus ingroup genomes. The difference between these two clades with respect to the proportions of ingroup-specific families that were present or absent was highly significant (χ2 test; P < 0.001; table 2).
Numbers of Ingroup-Specific Families Shared among Clades.
| P.MIT9303/P.MIT9313 Clade | Synechococcus Ingroup Cladea | Other Prochlorococcus Cladeb | ||
| Absent | Present | Absent | Present | |
| Absent (N = 4,507) | 1,986 (44.1%) | 2,521 (55.9%) | 2,476 (55.2%) | 2,021 (44.8%) |
| Present (N = 1,520) | 1,365 (89.8%) | 155 (10.2%) | 1,418 (93.3%) | 102 (6.7%) |
χ2 = 963.2; 1 df; P < 0.001 (test of independence).
χ2 = 724.3; 1 df; P < 0.001 (test of independence).
Similarly, only 102 of the 1,520 ingroup-specific families present in the P. MIT9303/P. MIT9313 clade were also present in the other Prochlorococcus genomes (table 2). Again the difference difference between these two clades with respect to the proportions of ingroup-specific families that were present or absent was highly significant (χ2 test; P < 0.001; table 2). Overall, 1,325 (87.2%) of the ingroup-specific families found in the P. MIT9303/P. MIT9313 clade were found in neither the ingroup Synechococcus clade nor the clade of other Prochlorococcus.
In the 155 ingroup-specific families found in both the P. MIT9303/P. MIT9313 clade and in the Synechococcus ingroup clade, the mean number of paralogs per genome in the former clade was 1.09 ± 0.18 and 0.62 ± 0.03 in the latter clade. The difference between means was significant (paired t-test; P = 0.013). The median number of paralogs per genome was 1.00 in the former clade and 0.60 in the latter clade, and the median values were significantly different (Wilcoxon test; P < 0.001). Similarly, in the 102 ingroup-specific families found in both the P. MIT9303/P. MIT9313 clade and in the clade of other Prochlorococcus, the mean number of paralogs per genome in the former clade was 0.92 ± 0.03 and 0.58 ± 0.04 in the latter clade. The difference between means was significant (paired t-test; P < 0.001). The median number of paralogs per genome was 1.00 in the former clade and 0.40 in the latter clade, and the median values were significantly different (Wilcoxon test; P < 0.001). Thus, the P. MIT9303/P. MIT9313 clade was characterized by both a unique set of ingroup-specific families not found in the other ingroup clades and by higher numbers of paralogs per genome in the ingroup-specific families that it shared with the other ingroup clades.
GIs
Since horizontally transferred genes are often found in GIs, we used the ALIEN HUNTER program (Vernikos and Parkhill 2006) to predict the occurrence of GIs in the 21 genomes (table 1). There were only one or two GIs in P. MED4, P. MIT9215, P. MIT9301, P. MIT9312, and P. MIT9515, with a total length less than 1% of the genome in each case (table 1). On the other hand, in seven of the Prochlorococcus genomes, GIs accounted for a higher percentage (24.8–40.5%) of the total length of the genome than in any of Synechococcus genomes (5.5–19.4%; table 1). P. MIT9303 and P. MIT9313 showed the greatest total length of GIs of all 21 genomes, in each case greater than that seen in any of the Synechococcus genomes (table 1). Likewise, in P. MIT9211, P. NATL1A, and P. NATL2A, the total length of the GIs in base pair was greater than that seen in any of the Synechococcus genomes (table 1). For the 21 genomes, the number of GIs was strongly positively correlated with the total length of GIs (r = 0.987, P < 0.001). However, neither the number of GIs (r = 0.386) nor the total length of GIs (r = 0.390) was significantly correlated with genome size (P > 0.05 in each case).
For all the ingroup genomes, there was a significant positive correlation between the total length of GIs and the number of ingroup-specific gene families (r = 0.741; P = 0.001; fig. 4B). By far, the highest numbers of ingroup-specific families were found in P. MIT9303 and P. MIT9313, which also showed the greatest total lengths of GIs (fig. 4B).
In order to control for possible effects of GIs on gene gain and loss, we compared only sets of genomes with intermediate GI total length (ranging from 3 × 10⁵ to 9 × 10⁵ bp). There were four such genomes in Synechococcus (S. CC9311, S. CC9605, S. CC9902, and S. WH8102) and five in Prochlorococcus (P. AS9601, P. MIT9211, P. NATL1A, P. NATL2A, and P. SS120; table 1). Considering the 13 branches ancestral to these genomes or to clades including only genomes belonging to the above sets, we compared gains and losses of gene families (fig. 2). In Prochlorococcus, there were 396 gene family losses and 72 gene family gains in these portions of the phylogeny (fig. 2), for a losses-to-gains ratio of 5.50. In Synechococcus, there were 203 gene family losses and 147 gene family gains in these portions of the phylogeny (fig. 2), for a losses-to-gains ratio of 1.38. The difference between the ratios was highly significant (χ2 = 72.4; 1 df; P < 0.001). Similarly, in these portions of the Prochlorococcus phylogeny, there were 136 losses of paralogs within gene families and 138 gains (fig. 3), for a losses-to-gains ratio of 0.99. By contrast, in these portions of the Synechococcus phylogeny, there were 78 losses of paralogs within gene families and 186 gains (fig. 3), for a losses-to-gains ratio of 0.42. Again, the difference between the ratios was highly significant (χ2 = 22.7; 1 df; P < 0.001). Thus, even when only genomes of comparable GI total length were compared, Prochlorococcus genomes showed a significantly greater tendency toward loss of both entire gene families and paralogs within gene families.
Discussion
We reconstructed events of gene loss and gain on a well-supported phylogeny of 17 cyanobacterial genomes belonging to the genera Prochlorococcus and Synechococcus (the ingroup genomes), rooted with an outgroup consisting of four additional Synechococcus genomes. The results supported the hypothesis that genome sizes in certain Prochlorococcus isolates have been reduced as a result of both the loss of entire gene families and the reduction of the numbers of paralogs within gene families. Kettler et al. (2007) previously examined gene loss and gain in Prochlorococcus, but our study was the first to examine separately both the loss of entire gene families and of paralogs within families. Moreover, by comparing these processes between Prochlorococcus and ingroup Synechococcus, we demonstrate that Prochlorococcus genomes have experienced both types of loss to a significantly greater extent than their sister clade, the ingroup Synechococcus.
Although there was evidence of gene family loss in two Prochlorococcus isolates with very large genomes (P. MIT9303 and P. MIT9313), our results suggested that these processes have involved rather different sets of families than those lost in other Prochlorococcus genomes. In addition, loss of paralogs within gene families occurred to a reduced extent in P. MIT9303 and P. MIT9313 in comparison to other Prochlorococcus isolates. In addition to their large genome sizes, P. MIT9303 and P. MIT9313 were unusual in having significantly increased representation of ingroup-specific gene families in comparison to other Prochlorococcus isolates. Across isolates, the extent of GIs was positively correlated with the number of ingroup-specific gene families (fig. 4B). The latter result supported the hypothesis that GIs play a role in HGT because many ingroup-specific gene families were likely to have been horizontally transferred to these genomes after the most recent common ancestor of the ingroup genomes. Moreover, the ingroup-specific families found in P. MIT9303 and P. MIT9313 were distinctive, being rarely shared with other Prochlorococcus or Synechococcus genomes (table 2), as expected if many of these families were acquired by HGT. Thus, HGT seems to have played an important role in the evolution of large genome sizes in P. MIT9303 and P. MIT9313.
Nonetheless, when we compared only Prochlorococcus and Synechococcus genomes with comparable GI extent, Prochlorococcus showed a significantly greater tendency than Synechococcus toward both the loss of entire gene families and the reduction of the numbers of paralogs within gene families. These results provided evidence against the hypothesis that differences in HGT alone can explain differences in gene number among these genomes. Rather, they suggest that repeated events of gene loss have been the main factor in genome size reduction in the smaller Prochlorococcus genomes.
An examination of some of the gene families lost in Prochlorococcus suggests that they are often involved in processes that are not relevant to the biology of planktonic bacteria of the open ocean. Some examples are summarized in table 3 (see also supplementary table S1, Supplementary Material online); most of these have been noted in previous literature on genome reduction in Prochlorococcus (Partensky and Garczarek 2010; Yooseph et al. 2010). Families undergoing loss in various Prochlorococcus genomes include those involved in uptake of DNA, amino acids, and sugars (table 3), all of which are likely to be in short supply in the open ocean (Giovannoni et al. 2005). Other genes that have undergone losses include those involved in nitrate metabolism, including those involved in the biosynthesis of the molybdenum cofactor of nitrate reductase (table 2; Partensky and Garczarek 2010). Nitrate also is in short supply in the open ocean (Giovannoni et al. 2005; Scanlan et al. 2009). Genes involved in assembly of the pilus and flagella are frequently lost (table 3), reflecting an environment where cellular motility is not advantageous for cells with reduced genome size (Yooseph et al. 2010). Overall, the pattern of gene family loss is suggestive of relaxation of purifying selection on gene families that are not needed in the open ocean environment, combined with a mutational bias toward deletion, as appears to be typical of prokaryotic genomes (Kuo and Ochman 2009).
Examples of Biological Processes Involved in Gene Family Loss in Prochlorococcus.
| Process | COG | Function |
| DNA uptake | COG1555 | DNA uptake protein and related DNA-binding protein |
| COG0758 | Predicted Rossman fold nucleotide-binding protein involved in DNA uptake | |
| Amino acid transport | COG0765 | ABC-type amino acid transport systems, permease component |
| COG0834 | ABC-type amino acid transport/signal transduction systems, periplasmic component | |
| COG0683 | ABC-type branched-chain amino acid transport systems, periplasmic component | |
| COG0531 | Amino acid transporters | |
| Sugar uptake | COG1175 | ABC-type sugar transport systems, permease component |
| COG1653 | ABC-type sugar transport systems, periplasmic component | |
| COG4975 | Putative glucose uptake permease | |
| Purine metabolism | COG0152 | Phosphoribosylaminoimidazolesuccinocarboxamide (SAICAR) synthase |
| COG0106 | Phosphoribosylformimino-S-aminoimidazole carboxamine nucleotide (ProFAR) isomerase | |
| Molybdenum cofactor and molybdopterin biosynthesis/nitrate metabolism | COG0303 | Molybdopterin biosynthesis enzyme |
| COG2896 | Molybdenum cofactor biosynthesis enzyme | |
| COG0476 | Molybdenum-guanine dinucleotide biosynthesis protein A | |
| COG0314 | Molybdopterin-converting factor, large subunit | |
| COG0521 | Molybdopterin biosynthesis enzymes | |
| COG0315 | Molybdenum cofactor biosynthesis enzyme | |
| COG1977 | Molybdopterin-converting factor, small subunit | |
| COG1251 | NAD(P)H-nitrate reductase | |
| COG2223 | Nitrate/nitrite transporter | |
| Pilus and flagellum assembly | COG2010 | Type II secretory pathway, ATPase PuIE/Tfp pilus assembly pathway, ATPase PiIB |
| COG4967 | Tfp pilus assembly protein piIV | |
| COG04972 | Tfp pilus assembly protein, ATPas PiIM | |
| COG3166 | TFp pilus assembly protein PiIN | |
| COG3166 | Flagellar biosynthesis pathway, component FlhA |
Kuo and Ochman (2009) suggest that nutrient-limited marine cyanobacteria may be an exception to the usual trend seen in bacteria, whereby genome sizes tend to be reduced in species with small effective population sizes. However, effective population sizes of Prochlorococcus are not well understood. The evidence of numerous distinctive ecotypes in Prochlorococcus (Rocap et al. 2003; Johnson et al. 2006; Partensky and Garczarek 2010) suggests the possibility that these bacteria may be in fact subdivided into numerous subpopulations that do not freely recombine. If this is true, the effective population size of certain such locally adapted ecotypes might be relatively modest. On the other hand, Hu and Blanchard (2009) showed that ratios of nonsynonymous to synonymous substitution are relative low in Prochlorococcus in general, providing evidence against the hypothesis that effective population sizes in this genus are reduced.
One selective hypothesis for the reduction of genome size in Prochlorococcus relates to advantages of reduced cell volume (Kuo and Ochman 2009). Because cell size and genome size are correlated, reduction of genome size can be a way to reduce cell size (Gregory 2001; Gregory et al. 2009). Smaller cell size might be advantageous in a nutrient-poor environment because it would imply a greater surface-to-volume ratio, facilitating the uptake of rare nutrients. Small size might also be advantageous in avoiding predation by bacterivores (Yooseph et al. 2010). Thus, it is possible that the evolutionary factors involved in genome size reduction in Prochlorococcus are complex, involving a combination of mutational bias toward gene deletion, relaxation of purifying selection against mutations causing the loss of nonessential genes, and ecological advantages derived from reduced cell size.
We thank Guanqun Shi (University of California, Riverside) and Georgios S Vernikos (The Wellcome Trust Sanger Institute) for technical assistance. This research was supported by grant GM43940 from the National Institutes of Health (NIH) to A.L.H, NIH GM078991003S1 to H.L. and J.T., and National Science Foundation (NSF) OCI 0904179 to J.T., using computational equipment acquired through NSF CNS 0808391.
References
Author notes
Associate editor: Manolo Gouy
